World
Renewable Energy Outlook 2030
a report to the Energy Watch Group
Authors: Stefan Peter, Harry Lehmann
Downloads: (English: Executive Summary, Short Version, Full Text / German: Executive Summary)
Executive Summary
The objective of this study is to present an alternative and - from our point of view - more realistic view of the chances of the future uses of renewable energies in the global energy supply. The scenarios in this study are based on the analysis of the development and market penetration of renewable energy technologies in different regions in the last few decades. The scenarios address the question of how fast renewable technologies might be implemented on a worldwide scale and project the costs this would incur. Many factors, such as technology costs and cost- reduction ratios, investments and varying economic conditions in the world’s regions, available potentials, and characteristics of growth have been incorporated in order to fulfil this task.
Off course the scenarios describe two possible developments among other possibilities, but they represent realistic possibilities that give reason for optimism. The results of both scenarios show that – until 2030 – renewable capacities can be extended by a far greater amount and that it is much cheaper than most scientist and people actually think. The scenarios do explicitly not describe a maximum possible development from the technological perspective but show that much can be achieved with even moderate investments. The scenarios do not pay attention to the further development of Hydropower, except for incorporating the extensions that are planned actually. This is not done to express our disbelief in the existence of additional potentials or to ignore Hydropower, but due to the fact that reliable data about sustainable Hydropower potentials were not available. Consequently, the figures in this study show how much can be achieved, even if Hydropower remains on today's levels more or less. Higher investments into single technologies,e.g. Hydropower or Biomass, or in general than assumed in the “REO 2030” scenarios will result in higher generating capacities by 2030.
On the global scale scenario results for 2030 show a 29% renewable supply of the heat and electricity (final energy demand) in the “High Variant”. According to the “Low Variant” over 17% of the final electricity and heat demand can be covered by renewable energy technologies.
Presuming strong political support and a barrier-free market entrance, the dominating stimulus for extending the generation capacities of renewable technologies is the amount of money invested. Within the REO scenarios we assume a growing "willingness to pay" for clean, secure and sustainable energy supply starting with a low amount in 2010. This willingness to pay gets expressed as a target level for annual investments per inhabitant (capita) that will be reached by the year 2030. The targeted amounts differ for the various regions of the world (see Table 1). In global average 124 €2006 are spent in 2030 per capita in the "High Variant". In the "Low Variant" the target for 2030 is half that amount (62 €2006 per capita and year).
This scenario approach requires considering the reduction of technology costs due to the growing market and the capability of industry to learn. To do so cost progress ratios for each technology, calculated from the total amount of investments into a specific technology and the resulting development of production volumes, are considered in the scenarios. The scenarios primarily address the development of the electricity capacities, heat supply by renewable energies gets partly studied. Fuels are not part of the study.
 |
||
 |
||
| The first bar shows the final energy demand in 2005 (grey), without breakdown to fossil or renewable sources. Bars 2 an d 3 show the development of final energy demand up to 2030, the renewables contribution (always green) according to the scenarios and the fossil & nuclear contribution (always black or grey). The remaining bars provide more details on the figure for 2030. Bar 4 shows the values for OECD (vertically hatched, black is fossil, green is renewable) and non-OECD (horizontally hatched). Bars 5 and 6 show details for OECD (bar 5) and non-OECD (bar 6), broken down to electricity (hatched lower left to upper right) and heat (hatched upper left to lower right). Again renewewables are green but fossils are grey this time. |
Figure 1: Final electricity and heat demand and renewable shares in 2030 in the High Variant (upper figure) and the Low Variant scenario (lower figure) [EWG; 2008]. Final Energy Demand: [IEA; 2006]
The future energy demand is taken from the “Alternative Policy Scenario” of the IEA's Study ”World Energy Outlook 2006” (WEO 2006). The OECD region will be able to cover more than 54% of its electricity and more than 13% of heat requirements from renewables in 2030, totalling a final energy share of 27% (low variant: almost 17%). In the non-OECD region, the share of renewables rises to 30% in the high variant (low variant 18%). Increases due to renewables account for almost 68% in regard to electricity, while renewable heat contributes about 17% of final heat demand (low variant: 36% of electricity and 11% of heat).
The scenarios show that renewable energy technologies have huge potential to help in solving the climate change problem, lowering dependence on fossil fuels, and making it possible to phase out nuclear energies. In both scenarios, the contribution of fossil and nuclear technologies increases until 2020. By that time, energy production by fossil and nuclear fuels exceeds the total final energy demand that existed in 2005. In the “Low-variant scenario”, this figure is only somewhat lower again in 2030. Looking at the “High-variant scenario”, the drop after 2020 is remarkable: in 2030 fossil and nuclear technologies have to contribute less to energy supply than the total level of energy demand in 2005.
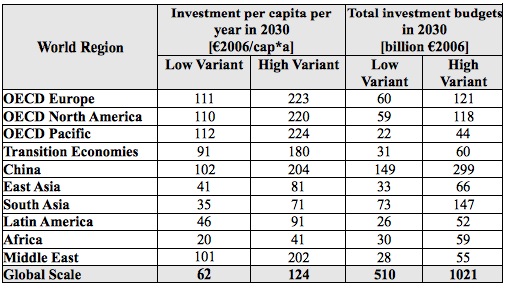 |
Table 1: Target investment 2030 per capita per year in various regions considered in the scenarios. All regions start with a low amount in 2010. [EWG; 2008]
Absolute investments in 2030 are approximately 510 billion €2006 in the ”Low Variant Scenario” and about 1,021 billion €2006 in the ”High Variant”. The biggest single investor in both scenarios is China, followed by South Asia – both regions having a high percentage of the world population – and OECD Europe, which is less populated but shows considerably higher spendings per inhabitant in 2030. OECD Pacific has the lowest investment figure, behind Africa, the Middle East, and Latin America.
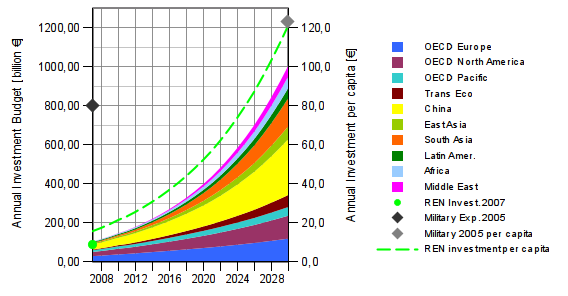
Investment sums of the dimension given here tend to be somewhat abstract and quickly appear to present an insurmountable barrier. To provide a better feeling for what such investment figures really mean with regard to today's real world, Figure 2 compares the renewable investments of this study to the global military expenditures in 2005 [SIPRI; 2006]. Only the ”High Variant” shows renewable per capita investments coming close to the military expenditures of 2005. Another illustrative comparison is the amount of money spent by each German in 2005 for culture-related activities - on the magnitude of 100€ annually [DESTATIS; 2008].
 |
||
 |
||
| Coloured areas and markers on the left ordinate (Y-axis) show the absolute annual investments, while the dotted line and markers on the right ordinate show annual investments per capita as global average. |
Figure 2: Development of investment budgets in the world regions in the ”High Variant” (upper figure) and ”Low Variant Scenario” (lower figure) [EWG; 2008]. Data on military expenditures: [SIPRI; 2006]. Data on REN investment 2007 [UPI; 2008].
According to an article published by United Press International in February 2008, the global investments in the renewable energy sector in 2007 (green dot in Figure 2) were about 117 billion US$, or 84 billion €; a figure closely approximates the investments in the ”Low Variant Scenario”.
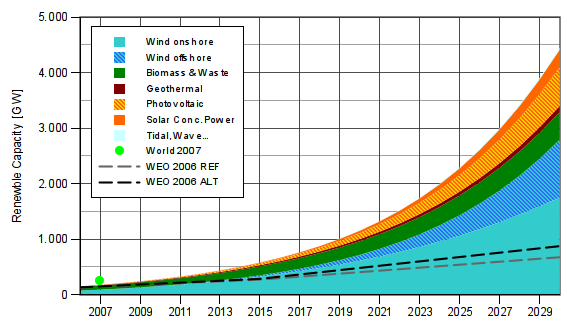
The difference in the development of installed renewable generating capacities in both scenarios is even greater than the difference in investment budgets. With about 4,450 GW of “new” renewable electricity generating capacity in 2030, the ”High Variant Scenario” is much more than double the capacity reached in the ”Low Variant Scenario” (1,840 GW).
 |
||
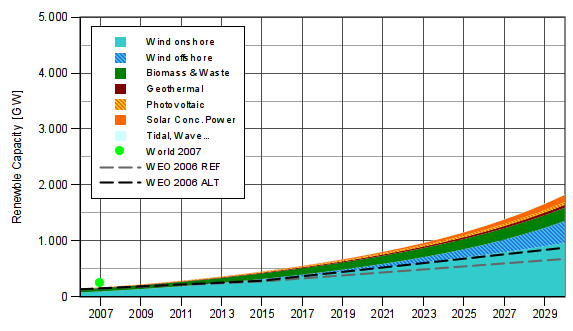 |
Figure 3: Development of “new” renewable electricity generating capacities in the world regions in the ”High Variant” (upper figure) and ”Low Variant Scenario” (lower figure) [EWG; 2008].Data on renewable capacity 2007: [REN 21; 2007].
The vast majority of the generating capacity in 2030 in both scenarios is onshore and offshore Wind Energy. Technologies in general develop much better in the ”High Variant Scenario”, but Photovoltaic can be seen as the big winner when the two scenarios are compared. PV, in fourth place in the ”Low Variant”, is the second-biggest contributor in the ”High Variant” (2030). Biomass & Waste follows in third place (second in the ”Low Variant”). Minor contributions come from Geothermal Power and Tidal, Wave and other Maritimes (“Tidal, Wave...” in Figure 3).
The scenarios deal with the extension of “new” renewables, i.e. hydropower is not part of the investment-budgets scenarios, but planned extensions of hydropower capacities (from about 762 GW today to about 856 GW in 2030) are considered because hydropower is the most important component of renewable electricity supply today and will still be important in 2030. Be that as it may, Hydropower loses its predominant role in both scenarios.
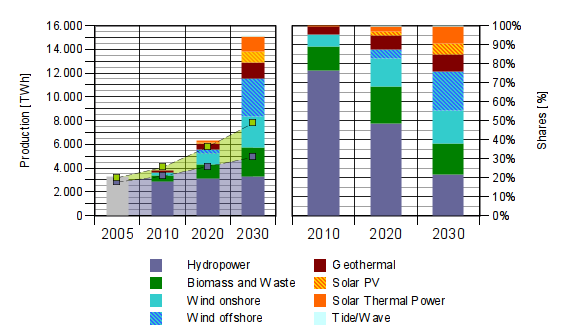
Electricity generation from “new” renewables increases with growing capacities. Starting with about 3,300 TWh in 2005, electricity generation increases to about 8,600 TWh in the “Low” and to about 15,200 TWh in the ”High Variant Scenario” (see bars in Figure 4).
Most of the “new” renewables production comes from Wind Energy, but the production share is not as high as the share in capacities. Nevertheless, in 2030 electricity production from Wind Energy comes close to Hydropower in the ”Low Variant”. In the ”High Variant” Wind Energy outpaces Hydropower by about 2,000 TWh. The second-biggest source among the “new” renewables is Biomass & Waste, followed by Geothermal and Solar Concentrating Power.
For a better comparison of what the scenarios mean with regard to the WEO 2006 “Alternative Energy Scenario”, the development of renewables in this scenario is represented by marked lines and transparent areas. It is easy to see that the WEO 2006 assumes a far greater extension of Hydropower capacities (purple markers and area in Figure 4), but the development of “new” renewables (green markers and area stacked onto Hydropower) definitely even falls behind the development in the “Low Variant Scenario”.
 |
||
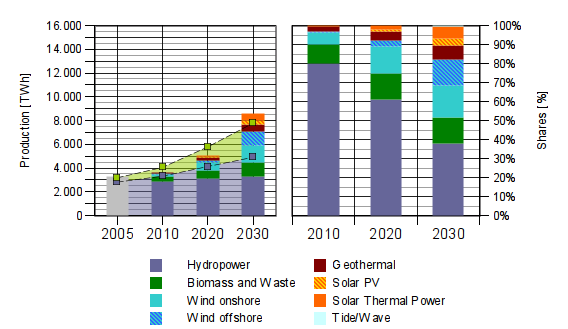 |
Figure 4: Development of electricity production from renewables in the ”High Variant” (upper figure) and the ”Low Variant Scenario” (lower figure), 2010 to 2030 [EWG; 2007]. Data 2005: [IEA; 2007b]
So far, only the electricity sector has been described, but heat supply also forms part of the scenarios. On one side, heat comes from cogeneration. Half of the Biomass & Waste and half of the Geothermal plants in the scenarios are cogeneration plants, producing heat and electricity simultaneously. Another heat producer in the scenarios is the solar thermal collectors, which account for a considerable percentage of investments in both scenarios. In fact, there is a bigger focus on solar thermal collectors in the ”Low Variant” than in the ”High Variant”. The reason for this is that solar thermal collectors are comparably cheap, and the ”Low Variant” has to get by with substantially lower investments.
The capacity of solar thermal collectors increases from 137 GW (2006) to almost 2,900 GW (2030) in the ”Low Variant”. The ”High Variant” shows an increase to about 3,800 GW. The difference between Biomass & Waste and Geothermal heat capacities in the two scenarios is proportional to the differences in electricity capacities, thus both are far lower in the ”Low Variant”.
Coming to final energy supply, about 30% of the final electricity and heat stem from renewable sources in the ”High Variant”. Consequently the percentage of renewables in the ”Low Variant” is less (more than 17 %).
Generally, renewables' share in electricity is considerably higher than in heat. Comparing the figures for 2030, renewable energy technologies contribute about 62% to final electricity and about 16% to final heat in the ”High Variant”. The related figures in the ”Low Variant” scenario are 35% of final electricity and 10 % of final heat originating from renewables.
Coming to a conclusion, both scenarios show an extension of renewable generating capacities that is far greater than the picture drawn even in the IEA's WEO 2006 “Alternative Policy Scenario”. Necessary investments into renewable generating capacities – often seen as the predominant problem – are relatively low, not only in the face of ongoing and accelerating climate change, but also in comparison to today's investment figures in other sectors. To achieve a level of development as described in the “High Variant Scenario”, it would be sufficient to raise investments in renewable generating capacities to 124€2006 per capita of the world's population until 2030; a per-capita investment the world has already seen for military expenditures in 2005. Half of this investment target would be sufficient for a development like in the “Low Variant Scenario”.
It took a long time to get scientific research focused on renewables and even more time was spent before renewable technologies could successfully be introduced into markets (e.g. in Europe). Once this happened and effective support mechanisms were implemented, such as the German EEG (Renewable Energy Law) with the feed-in tariff structure, renewables – and initially Wind Energy in particular – displayed dynamic development and increasingly became a “normal” part of thinking when dealing with the future energy supply.
A great deal of time was lost struggling over the reasons for climate change and the question of whether fossil energy resources would become scarce - and if so, when - before we recognised that the time to change our use patterns and supply of energy is now, is a task of today's generation. Starting sooner would of course have been more favourable. However, considering the relatively low investment figure and an almost 30% share of final energy demand, and that 62% of global electricity can be supplied by renewable technologies by 2030, there is reason for being optimistic that hummankind can come to grips with the problems of climate change and the reality of steadily depleting fossil energy sources.
Following a path of development as described in the “High Variant Scenario” would offer a substantial opportunity to reduce fossil and nuclear capacities in the global energy supply. Although the energy supply will require a striking amount of oil to fulfil energy demand until at least 2030, the problem of being strictly dependent on oil can be partially solved by a massive extension of renewables.
It is our strong conviction that nuclear power will not be needed if we undertake the types of development as proposed here. Furhtermore, we contend that there is no necessity to build new nuclear power plants, as proposed by the IEA, or to prolong the lifetime of existing ones. Using nuclear power, with all the associated problems (proliferation-prone nuclear material, final disposal of nuclear waste, severe accidents in nuclear power plants) can be discontinued - and this must take place as soon as possible. Instead of financing new nuclear plants, which definitely cannot provide a sustainable solution to our energy problems, this money should be invested in renewable technologies, which offer the only known sustainable solution to the world's energy-supply problems.
Although the scenarios demonstrate how renewable shares in energy supply can be increased significantly, they should also turn our attention to energy demand and its future development. In this study, we have referred strictly to the energy demand figures given in the IEA's World Energy Outlook 2006 “Alternative Policy Scenario”. As a result, even in the “High Variant Scenario”, the contribution of non-renewable sources to final energy supply in 2030 is almost as high as the total final energy demand was in 2005. This demonstrates impressively that we will also have to tackle energy consumption with the same level of effort we spend on the supply side. It might be questioned whether the IEA's demand projections are encouraging enough to deliver a perspective for solving the energy problems with which we will be confronted in the future. It is quite clear that there are huge potentials for energy savings, especially in the field of heat consumption, and that we will have to tap these potentials. This, however, is an issue to be addressed in future work.
